· 7 min read
What Is a Loss Curve?
A key component to enhancing AI's accuracy and reliability
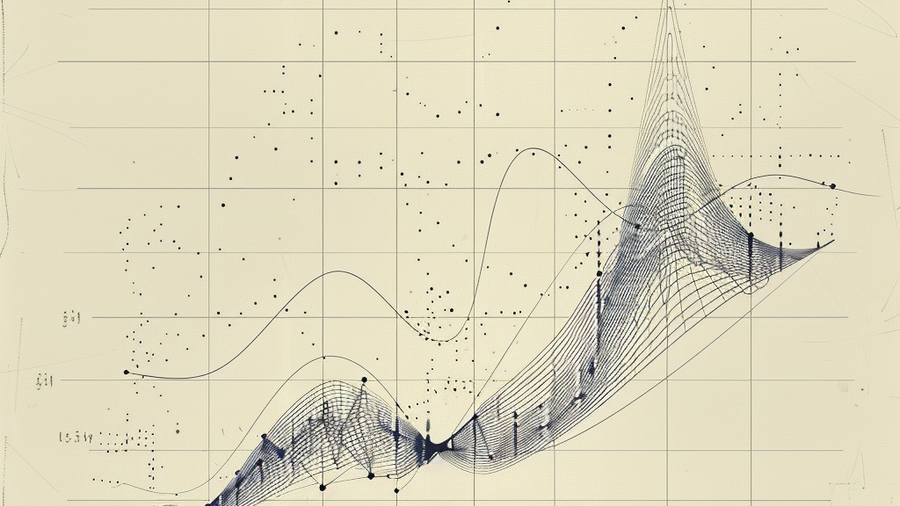
Here on the Kelvin Legal Data OS Team we often get asked about the concept of a “loss curve” —what it is and why it’s important. In this blog post, we aim to clarify this fundamental idea and highlight its significance in our ongoing development of our Kelvin Legal Large Language Model (LLM). Understanding the loss curve is key to enhancing our AI’s accuracy and reliability in legal applications, ensuring our technology not only meets but exceeds the sophisticated needs of our clients. Here is an example of one such loss curve diagram which was in our post entitled - What is and is not a Law GPT?

The Loss Curve: Tracking Model Performance Over Time
Imagine you are trying to perfect a recipe for chocolate chip cookies. The first batch might come out too crispy or too sweet, but with each batch, you tweak the ingredients—reducing sugar, adding more flour, adjusting the baking time—aiming for that perfect balance of flavors and textures. In this quest for the perfect cookie, each batch of cookies serves as critical learning moments, guiding your next steps in the kitchen. If the cookies are too sweet, you may decrease the sugar content and try again; if the cookies are overbaked, you try a minute or two less. This process of trial, error, and improvement closely mirrors the concept of a “loss curve” in machine learning, which tracks a computer model’s errors or “losses” as it learns from data, striving to perfect its predictions in much the same way one refines a cookie recipe.
A loss curve is essentially a graph that tracks the errors or “losses” a model makes as it learns from data. Just as a cookie recipe becomes better with each batch, a machine learning model aims to reduce its errors by adjusting its calculations. This process is akin to learning the right balance and mix of ingredients and bake time. The curve typically has two axes: the horizontal axis represents the number of training attempts or “epochs,” and the vertical axis shows the magnitude of error or “loss.” Ideally, as the model trains over more epochs, the curve slopes downward, indicating that the model is doing a better job of predicting the next word during this initial stage of training.
To make this more concrete, consider a model trained to predict house prices based on features like size, location, and number of bedrooms. Initially, its predictions might be way off, resulting in a high loss value. But as it processes more data, the model adjusts its internal parameters to improve accuracy, leading to a decrease in loss. This learning process is visually represented by the loss curve.
Training vs Validation
However, it’s not just about minimizing the loss on the training data; it’s crucial to ensure the model performs well on new, unseen data. This is where the concept of a “validation loss curve” comes in, paralleling our training loss curve. It measures the model’s performance on a separate set of data not used during training, helping identify when the model is just memorizing the training data (overfitting) rather than truly understanding the patterns. What we do not want is the validation loss to increase while the training loss decreases. This would be akin to a child learning to ride a bike for the first time on her own bicycle but the moment she picks up her friend’s bicycle she falls over and cannot ride. To test whether a child has truly mastered the skill of riding a bike, see if she can ride a bicycle other than her own; all things being equal, learning to ride a bike entails that one can ride any bicycle.
To summarize each form of loss -
Training Loss: This reflects how well the model is learning to predict the outcomes of the training dataset. A decreasing training loss suggests that the model is getting better at understanding the patterns in the training data.
Validation Loss: This measures how well the model performs on a separate dataset that it has not seen during training, providing insight into its ability to generalize to new data. A decreasing validation loss indicates that the model’s predictions are becoming more accurate on data outside of the training set.
In an ideal scenario, both the training loss and the validation loss should decrease to a point of convergence, indicating that the model is learning effectively and is capable of generalizing well to new data. This indicates that the model is learning from the training data and improving its ability to make accurate predictions.
Monitoring Loss to Identify Overfitting
It’s important to monitor the relationship between these two types of loss. If the training loss continues to decrease significantly while the validation loss starts to increase, this may indicate >overfitting. Overfitting occurs when the model learns the training data too well and to such an extent that it negatively impacts the model’s ability to generalize to new data. Essentially, the model becomes so tailored to the specific characteristics of the training dataset—including its quirks and anomalies—that it performs poorly on any data that differs from this training set, even slightly.
Overfitting is like studying for a test by memorizing the questions and answers from past exams without understanding the subject. When faced with new or slightly different questions on the actual test, you’re unable to apply what you’ve learned because you’ve only prepared for the exact scenarios you memorized. In practical terms, an overfitted model has “memorized” the training data rather than “learned” from it in a way that can be applied broadly. This results in high accuracy on the training data but poor performance on new, unseen data, because the model fails to generalize the patterns and relationships that are applicable beyond the training dataset.
Kelvin Legal LLM
In essence, the loss curve serves as a report card, showing how well the model is learning over time. By examining these curves, developers can fine-tune the training process—adjusting the learning rate, modifying the model’s architecture, or employing techniques to prevent overfitting—much like one can adjust the oven temperature, quality of ingredients or kitchen tools when searching for the perfect cookie recipe. This ensures the model not only learns effectively but can also apply its knowledge to new, unseen challenges, embodying the ultimate goal of machine learning.
The Kelvin Team utilizes loss curves to monitor the performance of our Kelvin Legal LLM, ensuring it meets the stringent accuracy and reliability standards required for legal applications. By analyzing both training and validation loss curves, the team can gauge our large language model’s learning progress and fine-tune its training regimen to enhance its understanding of legal language and concepts. This careful oversight allows us to identify when our foundational model is ready for downstream use cases.
Speaking of which, how does a foundational model like GPT-3.5 turn into the ChatGPT experience we all experienced? We’ll cover techniques typically used to adapt foundational models in future posts, including more information about our own “family” of models on offer.

Jessica Mefford Katz, PhD
Jessica is a Co-Founding Partner and a Vice President at 273 Ventures.
Jessica holds a Ph.D. in Analytic Philosophy and applies the formal logic and rigorous frameworks of the field to technology and data science. She is passionate about assisting teams and individuals in leveraging data and technology to more accurately inform decision-making.
Would you like to learn more about the AI-enabled future of legal work? Send your questions to Jessica by email or LinkedIn.